mlops-infra-ta
FastAPI OpenTelemetry Project
Summary
This project demonstrates how to effectively integrate FastAPI with OpenTelemetry to achieve enhanced observability. By combining FastAPI with OpenTelemetry and Grafana, you gain several advantages:
- Simplified Instrumentation: The project includes minimal customized instrumentation with OpenTelemetry, showcasing how easy it is to get started.
- Flexibility: The setup allows for flexible and extensible monitoring infrastructure management, enabling easy adjustments and scalability.
- Enhanced Observability: Leverage distributed tracing and monitoring to gain deep insights into your application’s performance and behavior.
- Near Real-time Visualization: Use Grafana dashboards to visualize metrics and traces in real-time, providing quick feedback and alerting capabilities.
Table of Contents
- Prerequisites
- Infrastructure Setup
- Seceret management
- oTelCol deployment
- Service Deployment
- Monitoring and Tracing
- To do
Prerequisites
Before you begin, ensure you have the following installed:
Infrastructure Setup
- Authenticate with GCP:
gcloud auth login gcloud auth application-default login -
Set Environment Variables:
Export the necessary environment variables for Terraform:
export TF_VAR_gcp_credentials_json="path/to/your/credentials.json" export TF_VAR_project_id="your-gcp-project-id" export TF_VAR_region="your-gcp-region" - Initialize Terraform:
terraform init -backend-config="gke-infra/terraform/backend_configs/staging-backend-config.hcl" - Create Infrastructure:
terraform apply -var-file="gke-infra/terraform/envs/staging.tfvars"This will create the necessary GKE cluster, deploy the OpenTelemetry Collector and the Grafana instance.
Secret Management
Before deploying the FastAPI service, create the necessary secrets to pass them as variables to the service.
- Create Secrets (example using
kubectl): In this repo, all the gke resources are build namespace otel-col. You could use your own namespace, such as monitoring-demo.kubectl create secret generic otel-endpoint --from-literal=OTEL_EXPORTER_OTLP_ENDPOINT=<your otel-collector endpoind> --namespace=otel-col kubectl create secret generic grafana-auth --from-literal=username="<your-grafana-cloud-instant-name>" --from-literal=password="<your grafana access token>" -n <your-name-space>note: the otel-col endpoint is
. .svc.cluster.local
Deploy otel-collector daemonset
```
helm repo add open-telemetry https://open-telemetry.github.io/opentelemetry-helm-charts
helm install otel-collector open-telemetry/opentelemetry-collector -f values.yaml
```
Verify if the pods are created.
```
./check_pod_all_logs.sh
```
Service Deployment
- Build and Push Docker Image:
docker build --platform linux/amd64 -t fastapi-otel:v2.0 . docker tag fastapi-otel:v2.0 <your-artifact-registry-rep>/<your-service-name:version> docker push <your-artifact-registry-rep>/<your-service-name:version> - Deploy to GKE Cluster:
Update the
deployment.yamlfile to include the correct image path from Google Artifactory.cd gke-infra/deploy/fast_api kubectl apply -f deployment.yamldeploy debug pod with traffic simulation script
 kubectl apply -f alpine-pod.yaml
 kubectl apply -f traffic-simulation-configmap.yaml
login to the pod
 kubectl exec -it apline-curl -n otel-col -- sh
 cd script
 traffic_simulation.sh
You should see some 200 and 422 responses from service. To check details you could check the log of the service pod. The metics which we custimised with open-telemetry export also to pod log, for debuging purpose.
kubectl logs -f <name-of-fast-api-service-pod> -n otel-col
Monitoring and Tracing
The FastAPI service is instrumented with OpenTelemetry, allowing for distributed tracing and monitoring.
-
Configure OpenTelemetry Collector:
See gke-infra/deploy/otel-collector/values.yaml
-
Access Metrics in Grafana cloud:
Assume you have already Grafana Cloud set up. Stack created, credential set up, enabled OpenTelemetry Connection Reference documentation: https://grafana.com/docs/grafana-cloud/send-data/otlp/send-data-otlp/
-
Configure Grafana Datasource:
- There will be datasource automatically available based on the connection set in pervious step.
- For metrics, go to default datasource connection, details see below image.
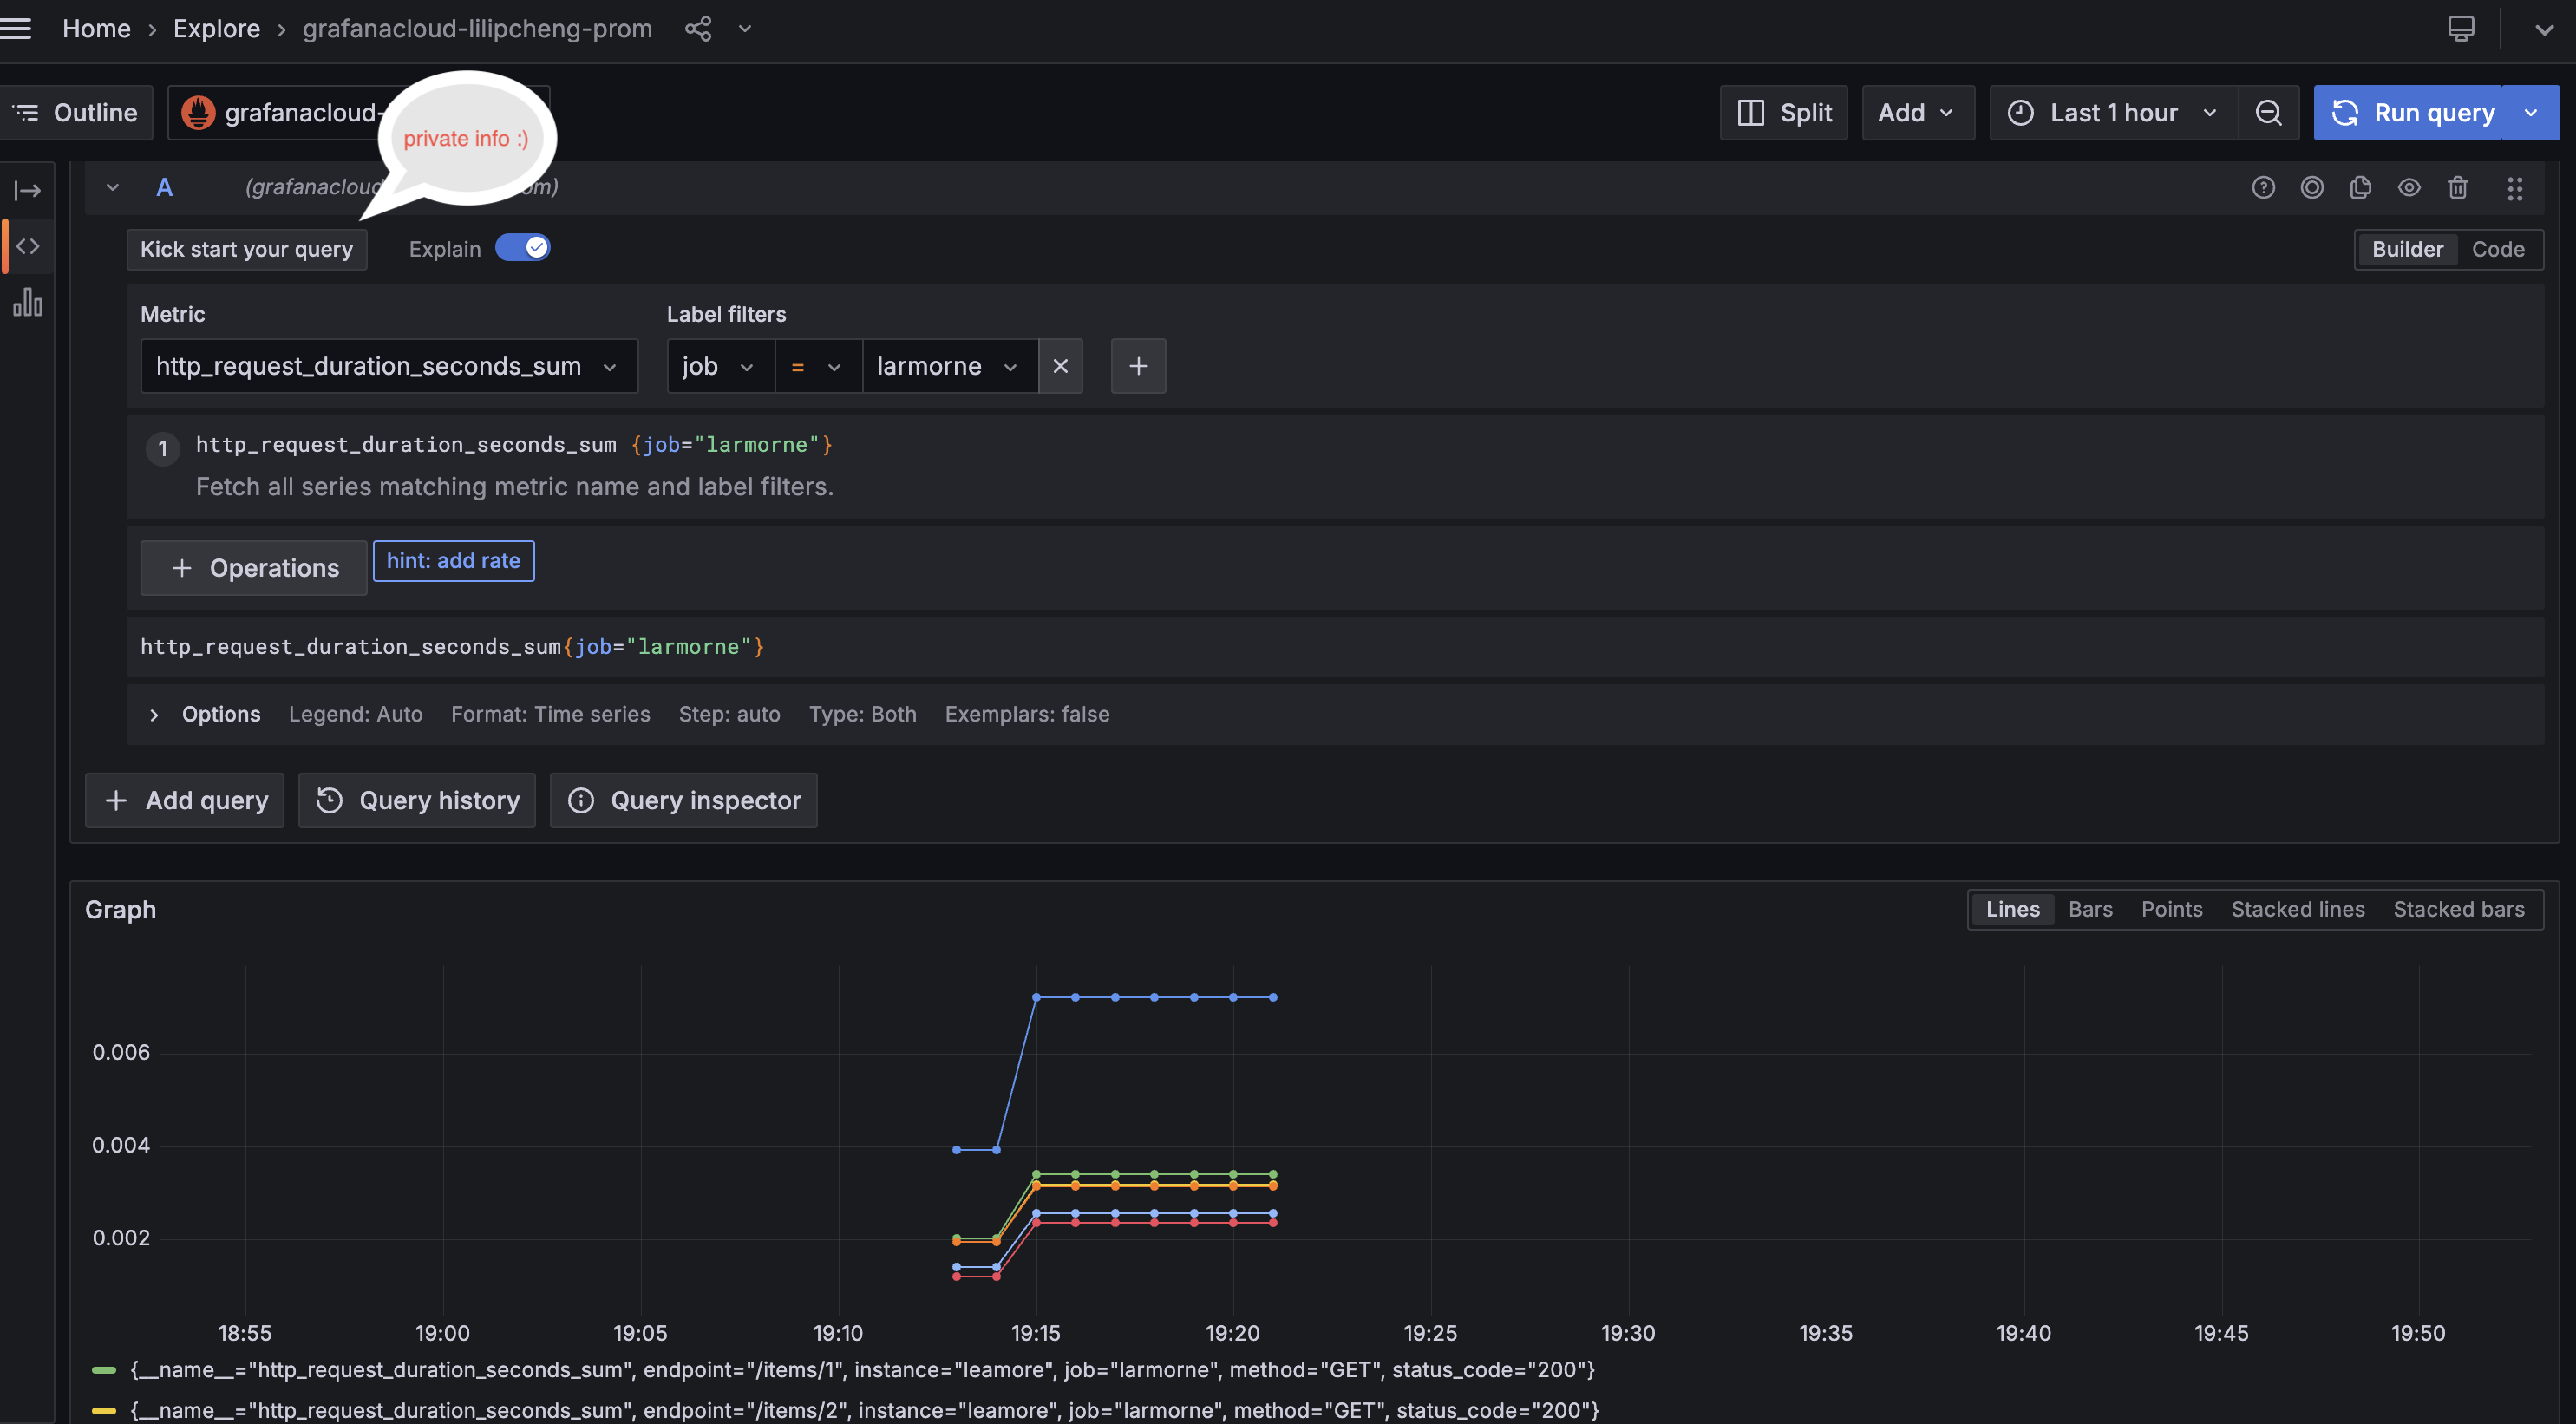
-
Create Dashboards: You can now create custom dashboards in Grafana to visualize the metrics collected by OpenTelemetry.
To do
- Set up alert via Grafana API.
- Customised more instrumentation for fastapi as well as for possible backends, such as postgress, redis, rocksdb.
- Migrate all GCP deployment to terraform.